Connection to DriversCloud Create a DriversCloud.com account Reset your DriversCloud.com password Account migration
3DMark authors publish new multi-media performance measurement tool
3DMark and PCMark are two major tools when it comes to machine evaluation. The former has just added a new string to its bow.
Finnish company formerly known as FutureMark, UL Benchmarks is one of the most renowned in the world of measurement tool design. Its tools, such as 3DMark and PCMark to name two of the best-known, are used by journalists and industrialists alike, as well as private individuals, to evaluate the performance of a machine as a whole or of individual components, in order to determine power levels, optimizations made or simple gains observed after a software or hardware upgrade.
For many years now, 3DMark has been one of the leading tools for determining the power of graphics cards or integrated graphics solutions. It covers the most powerful models from AMD or NVIDIA, as well as entry-level products, processors with integrated graphics and the SoCs in our smartphones. However, while 3DMark is available on multiple platforms, the tools implemented within the software were specific to graphics cards here, and smartphones there. No comparison seemed possible between these rather radically different machines.
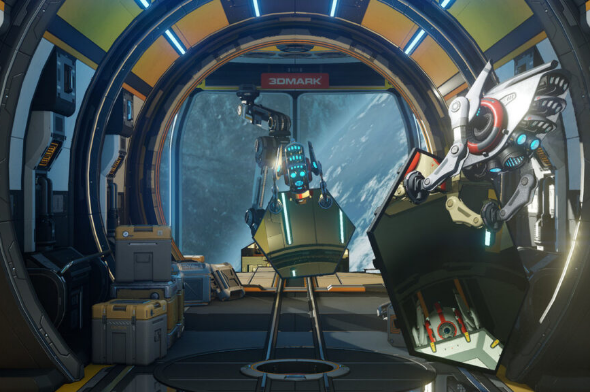
UL Benchmarks has just deployed the Solar Bay stage, a module clearly inspired by the design of the James Webb Space Telescope, with its structure of 18 hexagonal mirrors. Solar Bay has two parts: first, the Solar Bay benchmark, which the company describes as follows: " Run the 3DMark Solar Bay benchmark to measure a device's ability to deliver instant performance over a short period of time. This test mimics mobile games in which the game loop is a series of short bursts of activity. Solar Bay returns four scores: an overall score and three sub-scores for each ray tracing section. These scores reflect the frame rate of your device in Solar Bay; the higher the frame rate, the better the score ".
Alongside this tool, users can also employ the Solar Bay stress test, the purpose of which is explained as follows: " The Solar Bay stress test is a longer test that shows how a device will perform over longer periods of ray tracing play. It reflects a longer session of ray tracing gaming. This test runs the Solar Bay workload in a loop for 20 minutes, producing a graph showing how performance varies over the course of the test. An ideal result is a stable set of results showing that performance is not limited ".
Amusingly, the Videocardz website took advantage of the publication of this tool to compare the power of an NVIDIA GeForce RTX 4090 graphics card with that of a Samsung S23 Ultra smartphone. On the global stage, while the former achieves a score of 135,800 points, the latter has to make do with 5,539 points: the GeForce is therefore 24.5 times more powerful than the Samsung smartphone. It should be borne in mind, however, that UL Benchmarks does not specify that such comparisons can be made: thus, for the smartphone the result is an " overall score ", while for the graphics card it's a " graphics score ". Nevertheless, the difference observed is within the expected orders of magnitude.


